Project Introduction
At Students for the Exploration and Development of Space (SEDS) at Penn State, I am a member of the liquid rocket engine team working in the engine group. We are developing a liquid bi-propellant rocket engine utilizing ethanol and nitrous oxide for use in the 2023 Spaceport America Cup. On the engine team, I have focused on thermal-fluid analysis and various combustion device design and fabrication. This page will summarize engine specific information and the contributions I have made.
Engine Overview
The engine, shown below in Figure 1, was initially designed by other members of the SEDS PSU liquids team. The engine utilizes nitrous oxide and ethanol at an OF ratio of 5. It is designed to produce 800lbf of thrust at a chamber pressure of 400 psi. Due to ease of manufacturing and low cost, ablative cooling will be used within the chamber to prevent melting. The ablative will consist of a custom-made phenolic produced in-house. To inject the propellants, a pintle injector will be used because of its resistance to flow instabilities and throttling capabilities.

Contributions
Outlined below are each of the tasks that I specifically worked on for the duration of this project.
Nozzle Thermal Analysis
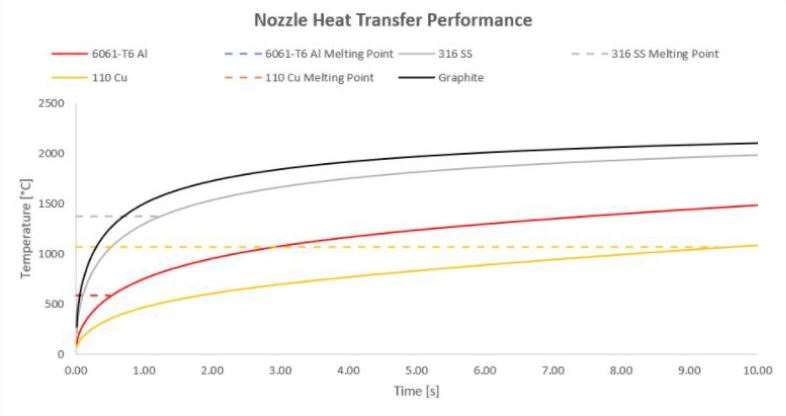
One aspect of this project involved determining a material for the nozzle for our specific application. Several material options ranging from aluminum to copper were proposed, but an in-depth analysis and trade study was required to verify what would work.
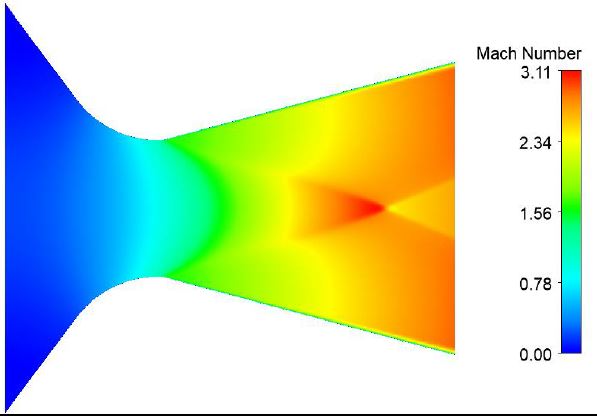
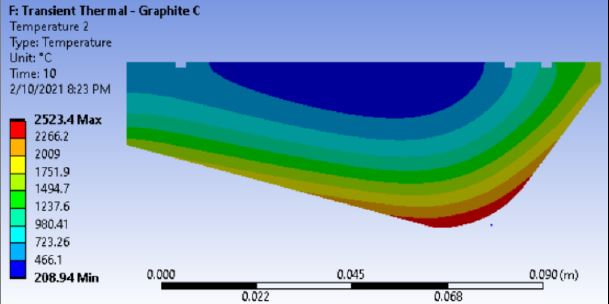
The analysis was performed in ANSYS using both Fluent and Mechanical. Using Fluent, the local Mach and gas side wall temperature could be computed. These values could be utilized in the Bartz equation for heat transfer in nozzles to find the heat transfer coefficient. Next, the geometry was imported to Mechanical and split into many discrete domains. To perform the thermal analysis, an average heat transfer coefficient and temperature was applied to each domain and then solved. The max temperatures for four materials were recorded for 10 second burns and compared to the melting points, costs, and strength degradation with temperature. Ultimately, graphite was selected as the material of choice due to its low cost and high temperature capabilities. Figure 2 displays some resultant images from this study. An in-depth report is also below detailing the methods and results.
Nozzle Thermal Analysis Report
Combustion Liner Thermal Analysis
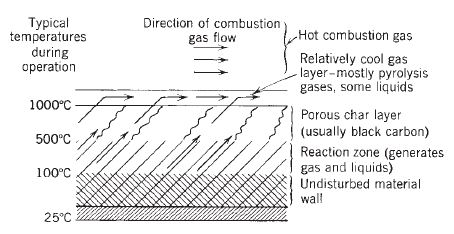
The engine is cooled using an ablative liner. Ablatives can prevent engine walls from heating up by undergoing an endothermic degradation composed of surface melting, sublimation, charring, decomposition, and film cooling. Figure 3 is pulled from Rocket Propulsion Elements and provides a schematic further detailing the degradation process.
To size the liner thickness, thermal studies were carried out in ANSYS Mechanical. Anticipated heat transfer coefficient and ambient fluid temperature values are approximated by RPA and employed as boundary conditions in a transient thermal study. The thermal conductivity of the liner was derived from a research study performed by the Southern Research Institute for NASA Langley. The liner we fabricate may not have the same properties, but it serves as a benchmark until the real liner properties can be measured. Due to the difficulty in modeling ablation, an alternative scenario for evaluating thermal effects as the material thins was selected. To model this thinning, the conductivity was kept constant and different thicknesses were evaluated to see how hot the chamber would get with thinner liners. While this is not a impregnable method of analysis, it allows us to approximate thickness and further validate with experimental tests. The three cases are evaluated below: no liner, 0.112” thick liner, and 0.2” thick liner.
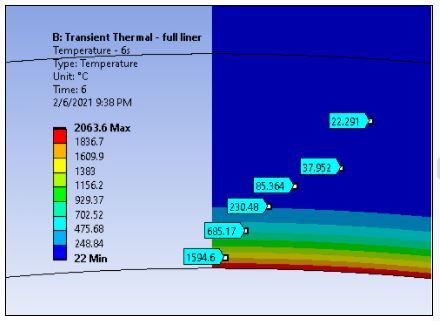
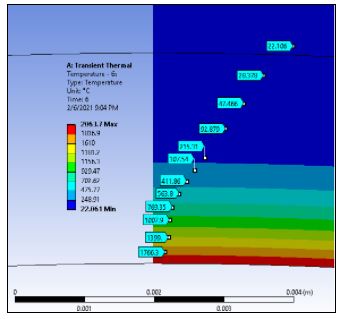
The first case, which utilizes no liner, is shown below in Figure 4. This preliminary study was conducted to validate that a liner would be required. It was found that the chamber temperature is expected to reach a maximum of 562°C for a 6 second burn, which is very near the melting point of 582°C for 6061-T6 Aluminum. In addition to melting, the yield strength of 6061-T6 Aluminum, as seen in Figure 5, begins to drop dramatically around 300°C, thus weakening the pressure vessel. Based on this, a liner is required.
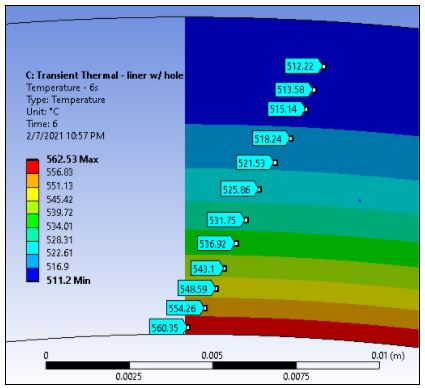

The remaining two studies are showcased in Figure 6. The image on the left is for the full liner thickness. The near wall temperature approaches combustion temperatures, but begins to taper off quickly, reaching ambient conditions halfway through the liner. When the liner thickness is halved, as seen in the second picture, the same trend is replicated. From this study, it is believed that a 0.2″ thick liner will work for preliminary tests and further modifications will stem from experimental tests.
Injector CFD Studies
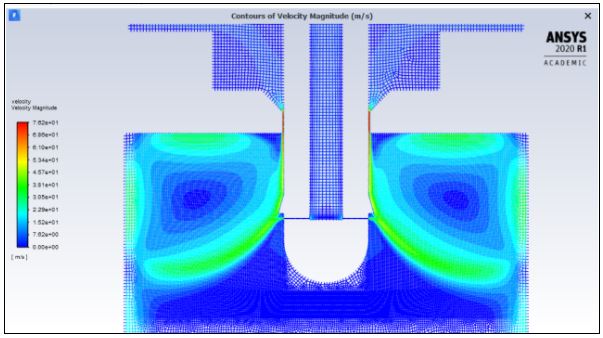
An attempt was made to predict the injector flow behavior using ANSYS Fluent. To simplify the model, the working fluid in these simulations was water, representative of a cold-flow test. A highly refined mesh was utilized in the region where impingement would occur of the oxidizer and fuel. Volume-of-Fluid (VOF) and Discrete Phase Models (DPM) were utilized to model fluid interactions and atomization. Atomization modeling proved difficult and efforts were halted. Shown below in Figure 7 is the velocity contour of the flow through the injector with a total momentum ratio (TMR) of 0.578. From this study, it was found that the impingement velocity is greater than 20 m/s, which is required for proper atomization as stated by RPA. A film cooling effect is also achieved along the edges of the combustion chamber, but the fluid also appears to circulate upwards after impinging on the wall, ultimately colliding with the impinging jets. Combustion effects are not modeled, but it is expected that combustion would prevent this from occurring. Studies on the 1-1 TMR produced similar velocity contours. Because of this, it was deemed that testing of 3D printed prototypes would be more viable for producing useful results.
Igniter Design and Manufacturing
Our team decided that using a pyrotechnic ignition system would be a good option for our first engine. Rather than sticking an igniter up through the nozzle like a standard solid motor, we opted to design a grain cartridge that could hold a small solid motor upstream the injector. A path is created from the grain cartridge to the combustion chamber, allowing hot exhaust gases to flow into the impinging flow, as shown in Figure 8.
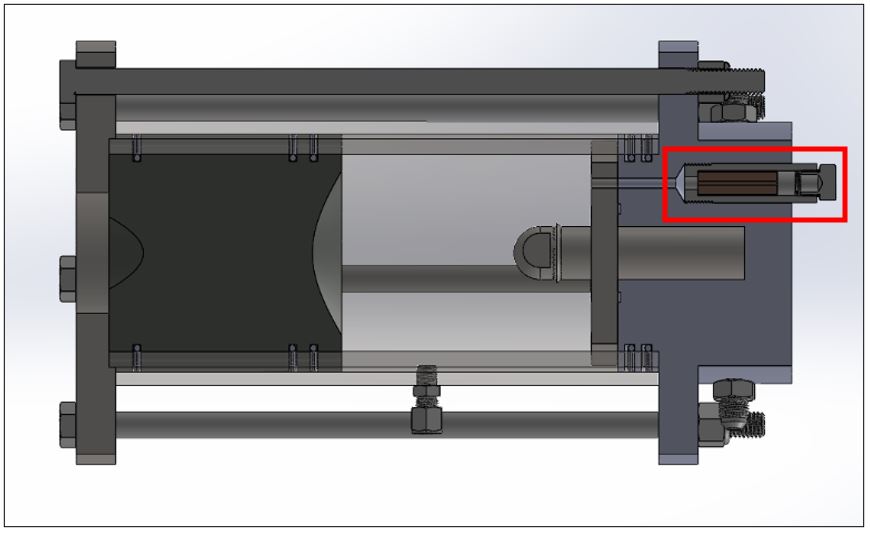
Figure 8: Engine with ignition system
This insertable cartridge design was selected due to its ease of replacement. It is anticipated that issues may arise with ignition timing and failures. By having a replaceable cartridge, the igniter can be swapped out quickly.
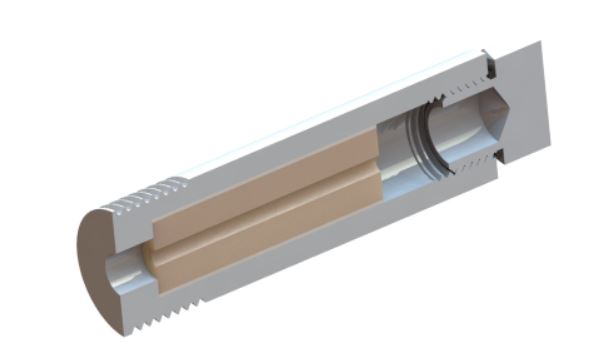
A long burn COTS motor will be placed inside the metal cartridge. The long burning low power motor will fire before the propellant is injected into the combustion chamber. The long burn is used to provide more leeway with timing propellant flow into the main chamber. Manufacturing is expected to occur during the Fall 2021 semester, but an image of the design can be seen in Figure 9.
Thermal Liner Manufacturing and Testing
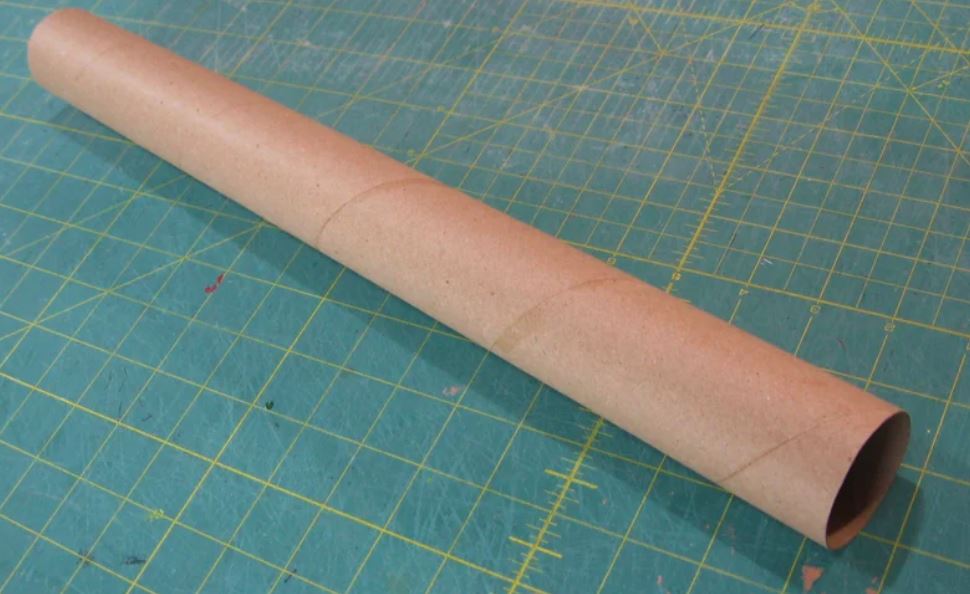
A low cost manufacturing technique is being developed to create the liner. The process consist of making a kraft paper tube and replacing the glue used between layers with a laminating epoxy. This is also expected to be accomplished in the Fall 2021 semester.
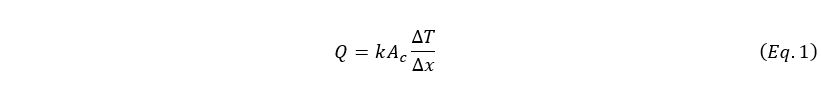
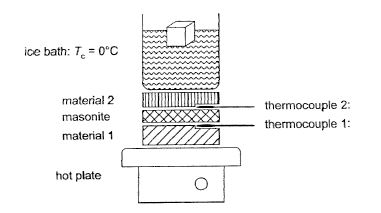
It is expected that the liner properties will not match the values used for simulation purposes. The get more accurate simulations, the thermal conductivity of the material needs to be measured. The schematic shown in Figure 11 outlines this process. The material will be placed between a constant heat supply and an ice bath. Thermocouples will be placed on each side of the surface. Using Equation 1, the thermal conductivity can be extracted. A more accurate image of the test setup will be provided at a later date.